Solution Design - EMS
This document describes the predefined Energy Monitoring System (EMS) developed by Analytics for Industry. This chapter describes the most important aspects: What, Where, When, Why, and Who.
What
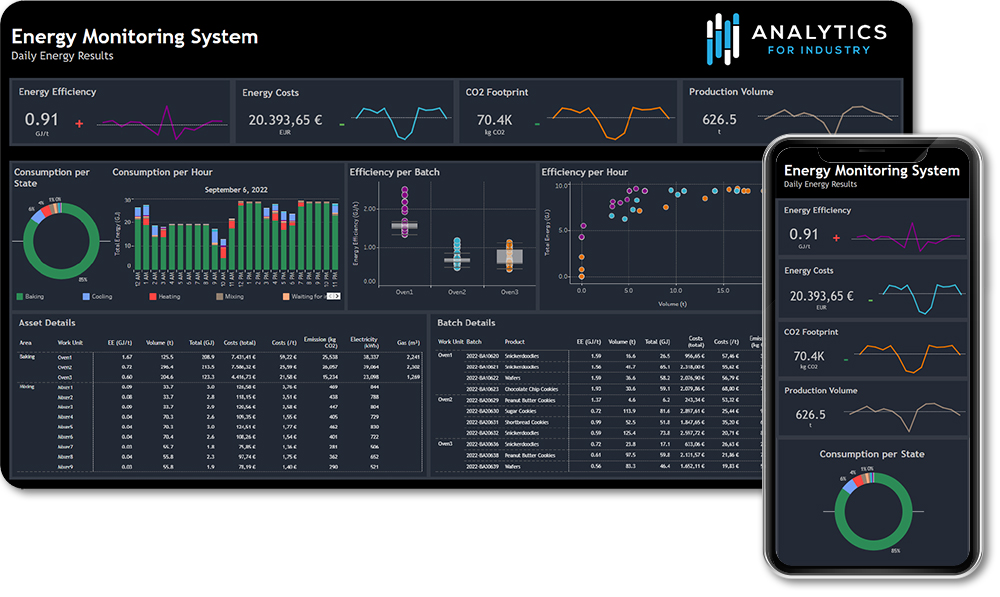
The EMS solution is a cloud-based data analytics platform. It provides end-users on all organizational levels with standardized KPIs presented in interactive dashboards for energy analysis and reporting. In addition, EMS gives insight in a company's WAGES (Water, Air, Gas, Electricity and Steam) consumption. It facilitates end-users to discover energy optimization by making data available for self-service analysis. EMS energy data relates to other relevant process data, like equipment states, batches, and production volumes. This unlocks the power of analyzing energy data in any potentially interesting context.
EMS is a standardized configuration template based on proven AVEVA cloud technology. It comes with a set of predefined dashboards that is adjustable to the information needs of its end-users. The predefined components automate the flow from source data to dashboards. Because our EMS is a predefined cloud solution, the implementation will only take five days, maintenance costs are almost non-existing, and upscaling (new sensors or even sites) can be done fast and easy.
In the next chapters, we will describe all predefined aspects, details and requirements on how to realize the solution.
Where, When and Who?
The EMS solution is developed for manufacturing companies looking for actionable insights in their energy consumption and need for a software tool that facilitates easy analysis, reporting, and information sharing based on the data captured by the sensors on the production floor.
Anyone within your company that is interested in energy consumption and/or optimization can use our EMS. From continuous improvement engineers to shift team leads, from process engineers to management executives. EMS ensures that everyone uses the same data set and works with the same KPIs regardless of role, site, or working location. Dashboards and reports are automatically updated with the most recent data and can be sent to your email or visited whenever the information is needed.
Why
There is a clear need to reduce global emissions on the road to Net Zero. To reach the emission goals as stated in the Paris Climate Accords, immediate action must be taken by governments, companies, and individuals. Implementing this EMS solution reduces energy consumption, saves costs, and keeps track the emission reduction goals of a company. In addition, the solution adds value to energy optimization by providing the following capabilities:
Automating the data transformation flow from sensor measurements to aggregated KPIs in standardized reports and dashboards
Energy measurements from physical devices (stored on tags) are automatically processed and prepared for KPI analysis;
Data is automatically normalized and converted to the most used generic engineering units for energy management (Gigajoules, CO2 etc.);
By default, 4 predefined dashboards (near real-time), based on best practices and most common Energy Monitoring requirements, are included in the product.
Calculating automated and standardized energy KPIs on any asset level
Data is linked to the physical (ISA-88) plant model and can be requested on any level in the ISA-88 hierarchy (if available);
Data can be shown for multiple time zones and currencies according to the end-users location, facilitating multi-site analysis.
Providing energy data in context to relevant production events and data
Data can be related to the active production events at the time of consumption (shift, batch, product, status, etc.);
Data will become relational, which makes it easy to compare multiple variables (both energy and non-energy related);
Advanced energy benchmarking and emission reduction tracking functionality becomes available.
Facilitating the creation of personalized energy reports and dashboards by end-users
The standardized data set that is generated by the system can be leveraged by its end-users to do self-service analytics and create personalized content;
End-users can create new customized calculations using the existing data.
Scale up very fast: connect new sites, assets or data within a limited time
End-users can easily extend the data set by adding data from new tags. Only a few actions are needed to add new sensors to the system. Then, data becomes immediately and automatically visible in a dashboard within 1 hour.
Sharing insights and knowledge within or outside an organization becomes easy
Alerts and notifications can be set for fast anomaly detection;
Advanced subscription functionality to dashboards/reports for distribution of dashboard extracts (multiple file formats possible);
User and content permissions (who can see what) are administrated centrally and can be customized to the end-users need.
Read further: